Smarter Roads, Part 2: Why Roads Matter More Than We Think
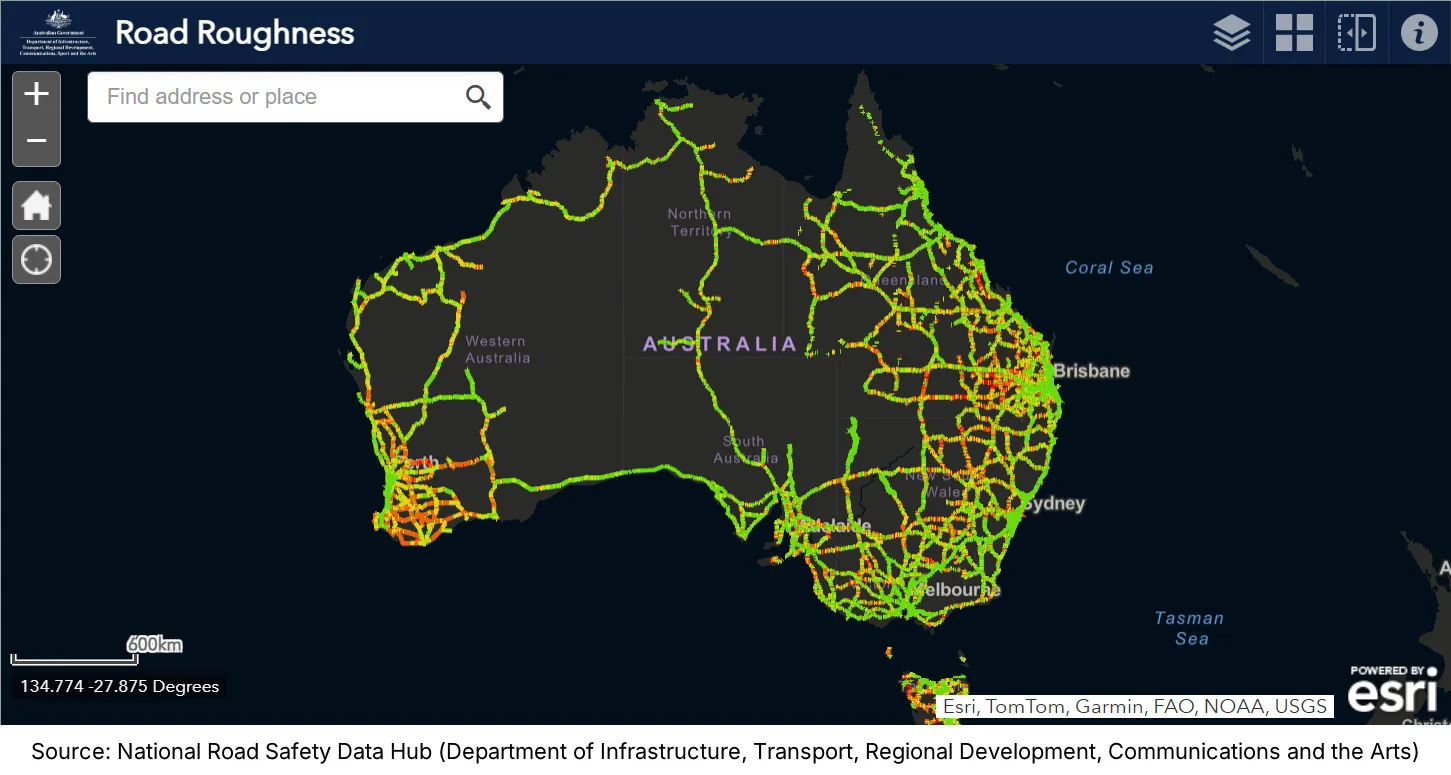
Australia’s road network is enormous. It is one of the largest public assets we maintain, and one of the most expensive. Before exploring sensors, AI models, or any technical experiments, it is worth understanding the scale of the system we are trying to improve.
This chapter maps the first part of the problem space: the size, cost, and growing pressure on Australia’s roads.
Roads Are One of Australia’s Most Expensive Public Assets
The Bureau of Infrastructure and Transport Research Economics (BITRE) publishes detailed road‑related expenditure each year [1]. Their 2024 report shows that road spending spans all levels of government, with state and territory budgets carrying the largest share of maintenance and renewal costs.
Queensland alone has accumulated more than $8 billion in required road repairs and resurfacing work as of the last financial year [3]. That backlog reflects a broader national trend: maintenance needs are rising faster than budgets [1].
Road spending has steadily increased since the late 1990s, driven by population growth, freight demand, and the rising cost of materials and labour [2].
A Network That Touches Every Part of Life
Australia relies on its roads for almost everything:
- commuting
- freight and logistics
- emergency services
- public transport
- cycling and micromobility
- tourism
- regional connectivity
When roads degrade, the impact ripples across the entire economy. Delays increase. Freight becomes less efficient. Safety risks rise. Councils face higher repair costs.
Maintaining this network is a massive responsibility, and the complexity grows every year.
State-Level Differences
BITRE’s expenditure data shows that each state faces different pressures [1]:
- Queensland manages the largest state‑controlled road network, with heavy weather impacts and long regional corridors.
- New South Wales and Victoria face higher costs from dense traffic and complex urban infrastructure.
- Western Australia manages vast freight routes across remote areas.
These structural differences shape how maintenance budgets are allocated and where the biggest gaps appear.
Local Context: Brisbane and South-East Queensland
Brisbane City Council does not publish a standalone road‑maintenance total, but Queensland’s 2024–25 Transport and Roads Investment Program confirms:
- $11.5 billion in statewide road investment [3]
- A significant portion directed outside Brisbane, reflecting the size of the regional network
The statewide backlog of $8 billion in required repairs gives a clear indication of the scale of the challenge facing councils across Queensland [3].
Why This Matters
Understanding the scale of the network reframes the challenge:
- The problem is not just potholes.
- The problem is maintaining one of the world’s largest road networks with limited data, rising costs, and increasing environmental stress [1][2].
- The gap between what is needed and what is possible is widening [3].
This is why early detection matters. And it is why the next chapters will focus on how defects form, why detection is slow, and how sensing and AI might help.
In the next post, we will look at how road defects actually form, and why they escalate so quickly when they are missed early.
References
- Road-related Revenue and Expenditure - Bureau of Infrastructure and Transport Research Economics, 2024
- Road Spending - National Road Safety Data Hub, 2022
- Queensland government vows to 'do a better job' of maintaining roads - ABC News, 2025